Upload date
All time
Last hour
Today
This week
This month
This year
Type
All
Video
Channel
Playlist
Movie
Duration
Short (< 4 minutes)
Medium (4-20 minutes)
Long (> 20 minutes)
Sort by
Relevance
Rating
View count
Features
HD
Subtitles/CC
Creative Commons
3D
Live
4K
360°
VR180
HDR
131 results
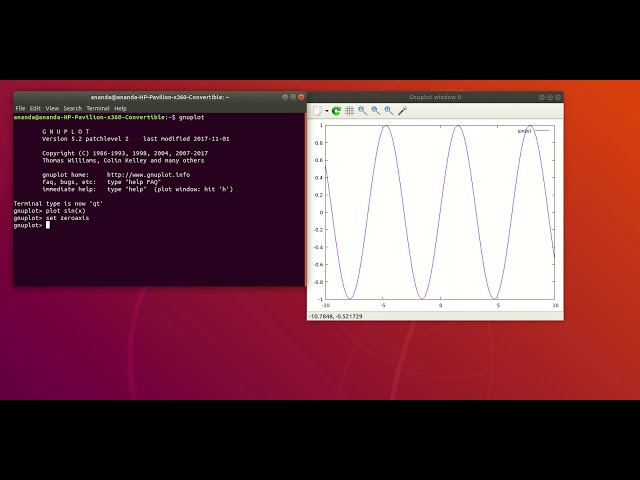
This is the first in a series of videos on the plotting program called gnuplot. In this video, I discuss the basics of using gnuplot to ...
2,738 views
6 years ago
EmacsConf 2022: Health data journaling and visualization with Org Mode and GNUplot - David O'Toole (he/him) ...
2,668 views
3 years ago
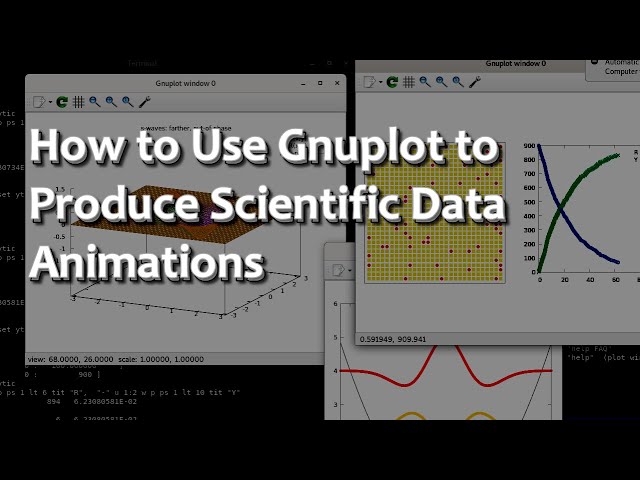
How to Use Gnuplot to Produce Scientific Data Animations ----------------------------- Are you looking for a simple way to illustrate ...
6,701 views
5 years ago
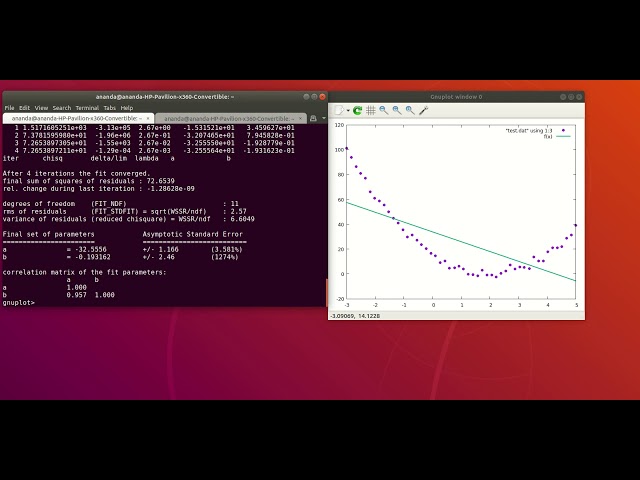
In this video, I describe how to use gnuplot to fit functions to data that is stored in a file. I describe both linear and non-linear fits ...
1,077 views
This is the second in a series of videos on the gnuplot plotting program. In this I discuss the basics of how to plot data from files ...
1,573 views
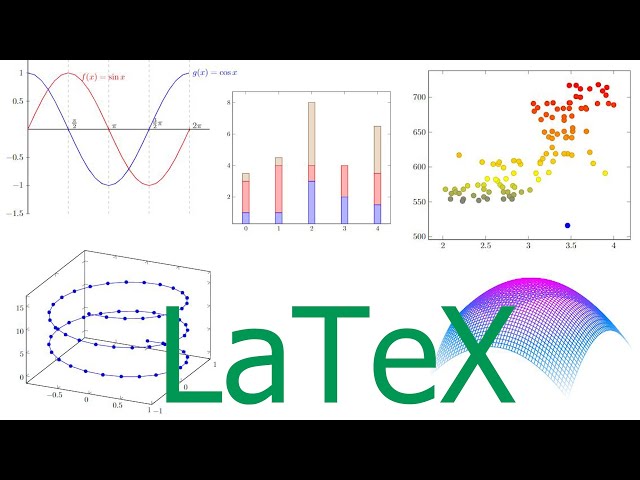
Get started with LaTeX using Overleaf: ▻ https://www.overleaf.com/?utm_source=yt&utm_medium=link&utm_campaign=im22tb.
564,585 views
This is the third video of the series. In this I discuss user defined functions. I describe the use of the gnuplot ternary operator (?
1,300 views
NS2 #Gnuplot #AWK #TraceFiles #Throughput #Graph #Nam #WirelessNetworks #Research #Simulation This tutorial has step ...
7,510 views
4 years ago
Streamed Live on Twitch: https://twitch.tv/tsoding Enable Subtitles for Twitch Chat Chapters: - 00:00:00 - Intro - 00:06:46 ...
20,513 views
5 months ago
You can find the lecture notes and exercises for this lecture at https://missing.csail.mit.edu/2026/debugging-profiling/ 0:00:00 ...
2,138 views
1 day ago
In this video we will cover the basics of how to take a code project on your computer and open source it on GitHub, as well as how ...
2,511 views
DataEDGE 2013 - http://dataedge.ischool.berkeley.edu The Raw and the Cooked: The Mythologies of Big Data Kate Crawford, ...
5,322 views
12 years ago
In this video, Oliver Reinhardt introduces you to two different ways to advance time in an agent-based simulation, identifying some ...
2,178 views
Watch Bryan Cantrill (CTO at Joyent, formerly Distinguished Eng. at Sun and DTrace creator) as he discusses dreams, nightmares ...
16,168 views
7 years ago
Have you ever thought it would be better to make stylish charts by Ruby for daily data visualization tasks that sometimes occur?
306 views
Daniel Freed, University of Texas, June 8, 2021 The two-dimensional Ising model revisited.
947 views
Inside Sphere and Monte Carlo Method Prof. Ankit Bansal Department of Mechanical & Industrial Engineering IIT Roorkee.
1,259 views
jk Michael Sullivan ily That music sync at 18:20 was entirely accidental and I love it. Music: https://www.bensound.com/
320 views
Fun Training - Modern Fortran Basics: Day 1, Part 1 July 10, 2023 Presenter: Brad Richardson.
1,048 views
2 years ago
99 views


![[JA] Charty: Statistical data visualization in Ruby / Kenta Murata @mrkn](/api/proxy/image?url=https%3A%2F%2Fi.ytimg.com%2Fvi%2FiHOWyQt4y-Q%2Fsddefault.jpg)