Upload date
All time
Last hour
Today
This week
This month
This year
Type
All
Video
Channel
Playlist
Movie
Duration
Short (< 4 minutes)
Medium (4-20 minutes)
Long (> 20 minutes)
Sort by
Relevance
Rating
View count
Features
HD
Subtitles/CC
Creative Commons
3D
Live
4K
360°
VR180
HDR
776 results
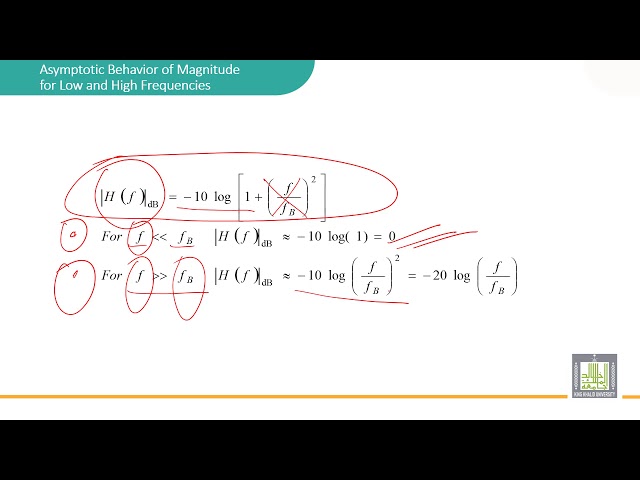
In this video, I have plotted the magnitude plot of a transfer function.
48,074 views
6 years ago
In this video I have drawn the phase plot for the transfer function which has it's magnitude plot in the video below: ...
50,011 views
7 years ago
490 views
9 years ago
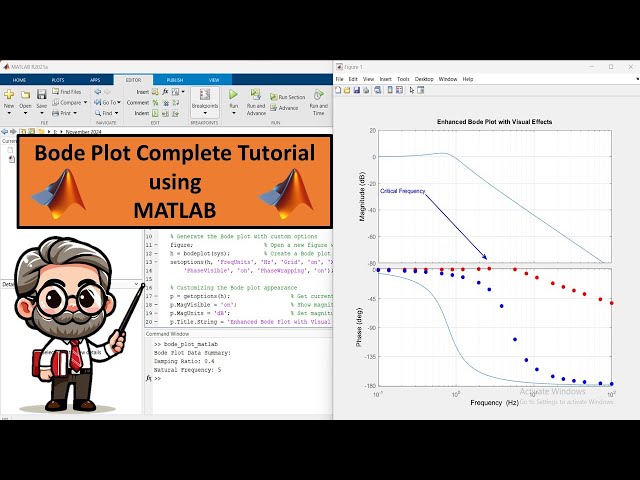
Get instant access to MATLAB & Simulink books, guides, and course files to boost your skills! Get Access Now: ...
349 views
1 year ago
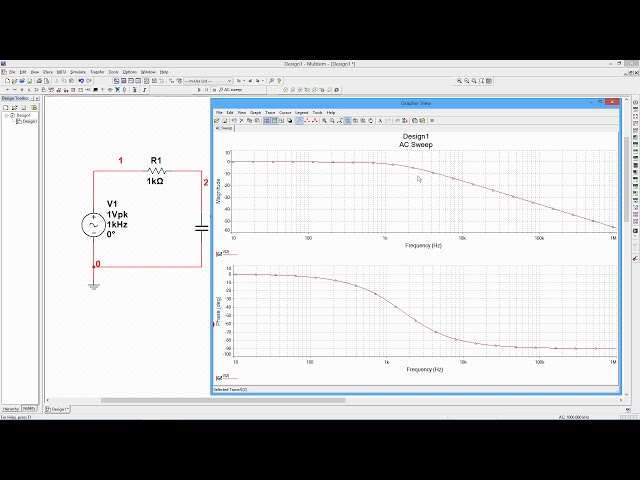
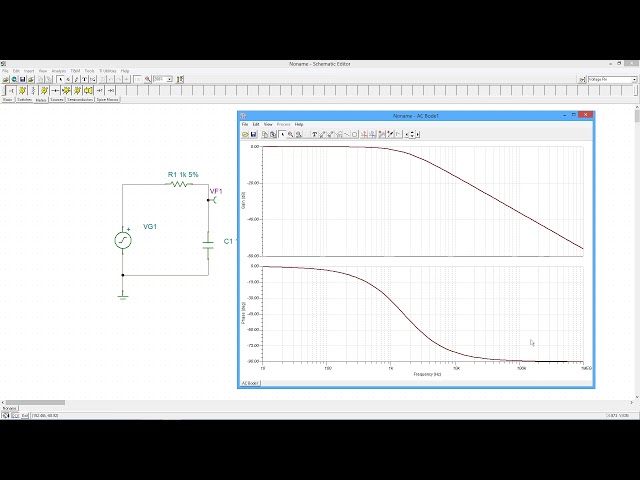
In this video, we explore the basics of frequency domain analysis using the Student Edition of the Multisim circuit simulator.
48,242 views
5 years ago
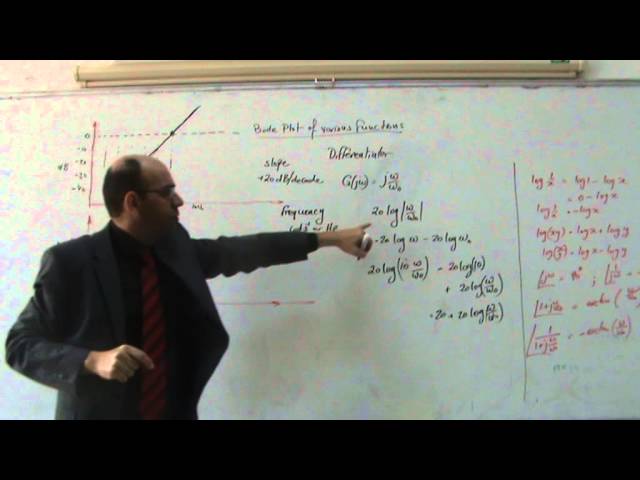
This video explains a very simple and accurate method to draw bode plot. it is divided into four part, this video lecture is the part ...
52,317 views
Table of Contents: 00:00 - Corners & starting pts 02:36 - Ex 1 Asymptotes 03:53 - Ex 1 Sketch 05:36 - Ex 2 Asymptotes 06:30 - Ex ...
1,059 views
10 years ago
Learn more at: https://en.wikipedia.org/wiki/Bode_plot Content adapted from Wikipedia under CC BY-SA 4.0 Gain – The ratio of ...
39 views
6 months ago
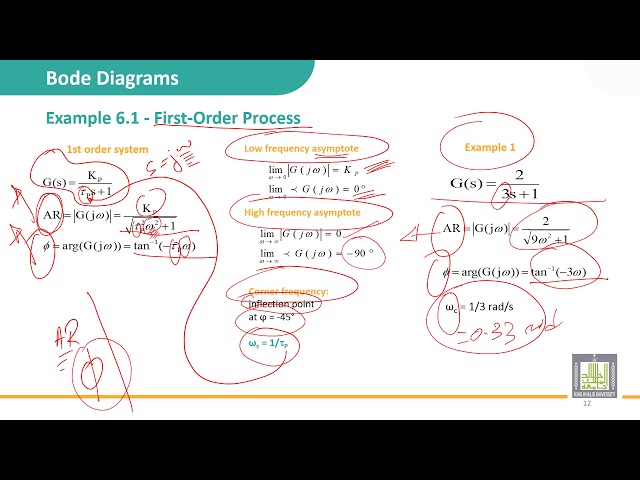
جامعة الملك خالد - عمادة التعلم الإلكتروني المقررات المفتوحة - التحكم الألي Automatic Control الوحدة 6 : Frequency response and Bode ...
542 views
Table of Contents: 00:00 - Example 1 Approximate mag & phase 04:08 - Example 2 Approximate mag & phase 07:10 - Sinusoidal ...
544 views
529 views
In this video, I am obtaining the transfer function corresponding to the Bode Magnitude Plot.
2,995 views
1,114 views
1. Define a continuous time system: second and higher order 2. Response plot for step input 3. Response plot for sine input 4.
4,966 views
11 years ago
How to find the damping ratio of a 2nd order system by looking its bode diagram? Helpful? Please support me on Patreon: ...
57 views
4 years ago
587 views
This video discusses what a Bode Plot is. It shows the logarithmic frequency scale used in both gain and phase plots. It shows ...
24,166 views
12 years ago
In this video, we explore the basics of frequency domain analysis using the TINA-TI simulator. Using a simple resistor-capacitor ...
19,015 views
link to the accompanying pdf document *). This video, which is part of the frequency response methods, develops the Bode plot of ...
9,528 views
1,525 views
693 views
A mostly artificial base-element. The derivation-, derivating- or D-element. We will get to know the transfer function, the step ...
93 views
1,818 views
Replaced by: https://youtu.be/RiAyG8O56ic This is an example on how to calculate a frequency response. The example is a ...
35 views
8,533 views