Upload date
All time
Last hour
Today
This week
This month
This year
Type
All
Video
Channel
Playlist
Movie
Duration
Short (< 4 minutes)
Medium (4-20 minutes)
Long (> 20 minutes)
Sort by
Relevance
Rating
View count
Features
HD
Subtitles/CC
Creative Commons
3D
Live
4K
360°
VR180
HDR
125,032 results
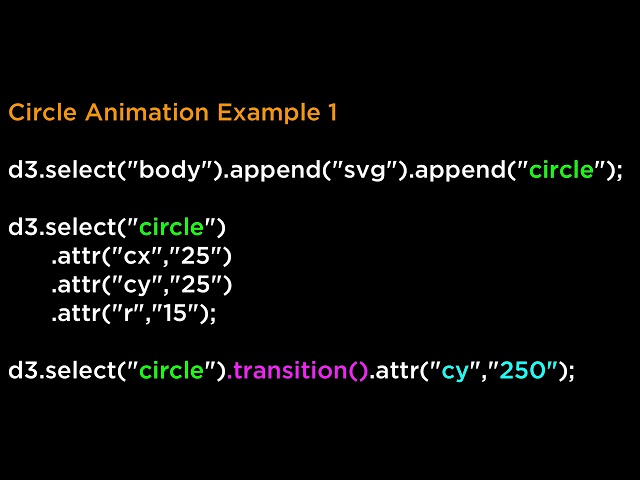
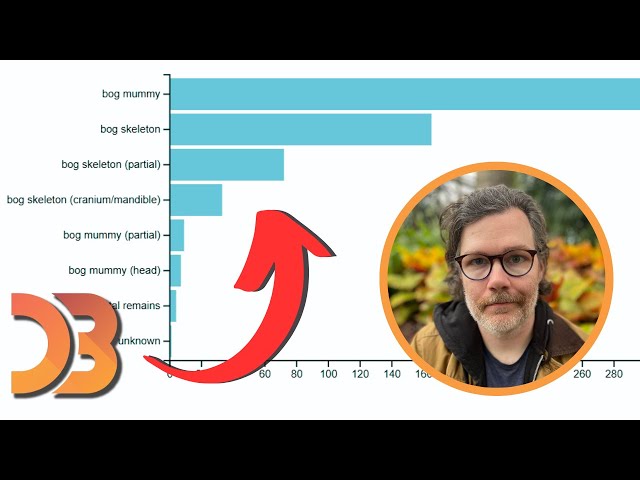
Create and Use SVG Transition Animations using D3.js to create amazing Data Visualizations. D3.js v3 Tutorial.
1,011 views
4 years ago
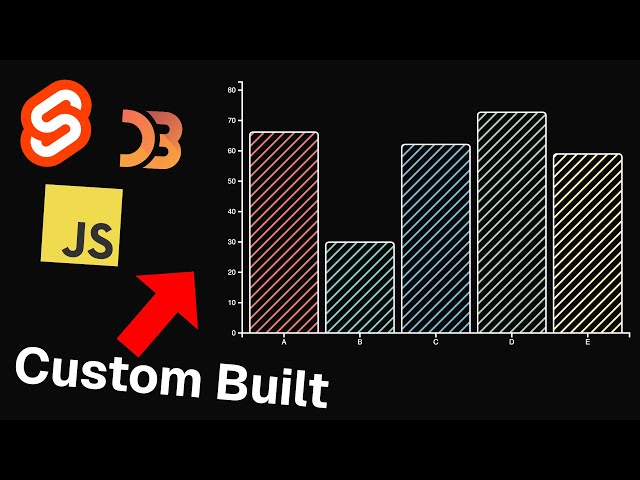
Wanted to show off something I'm working with D3 and Svelte (a fantastic combination btw). Check out the repo here: ...
12,061 views
1 year ago
Welcome to a youtube channel dedicated to programming and coding related tutorials. We talk about tech, write code, discuss ...
61,022 views
6 years ago
Link to prototype: http://kodhus.com/kodnest/codify/1581856a270164263514a596842528a6/layout/1.
31,896 views
5 years ago
Sign up for https://funfun.email to learn more about our D3 and data visualization plans! Dirty D3 won't be the most pedagogical ...
14,610 views
Create Beautiful Line Charts in D3 - Beginners Guide. In this three-part series, I'll walk through building a basic D3.js line chart, ...
24,263 views
2 years ago
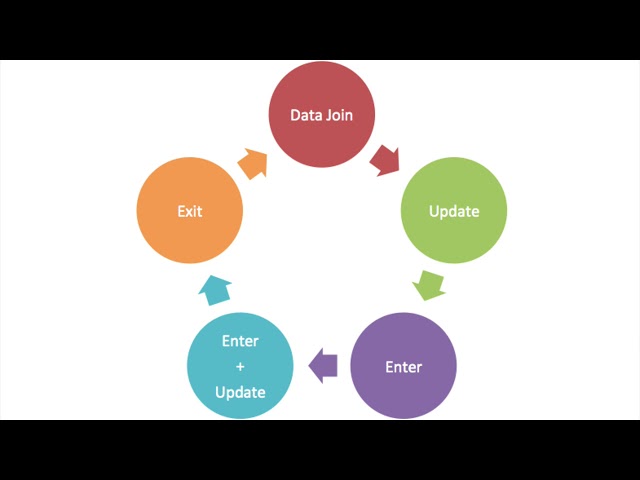
Learn how to deal with Dynamic Data and the D3.js Update Data Function in order to create amazing Data Visualizations! D3.js v3 ...
1,218 views
Complete D3.js Pie Chart how-to example so that you can build your very own amazing D3.js Pie Chart Data Visualization! D3.js ...
1,082 views
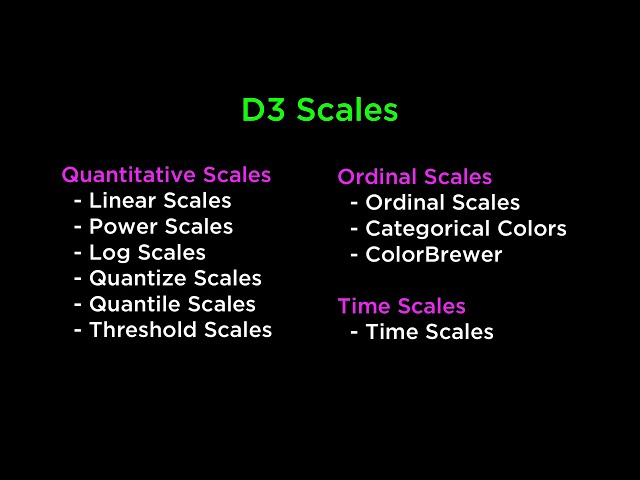
D3 Scales Tutorial to help you understand how to create amazing Data Visualizations! D3.js v3 Tutorial.
1,000 views
Learn how to best combine React's Diff engine and D3's math skills to create performant, interactive dashboards! Github Repo: ...
13,902 views
3 years ago
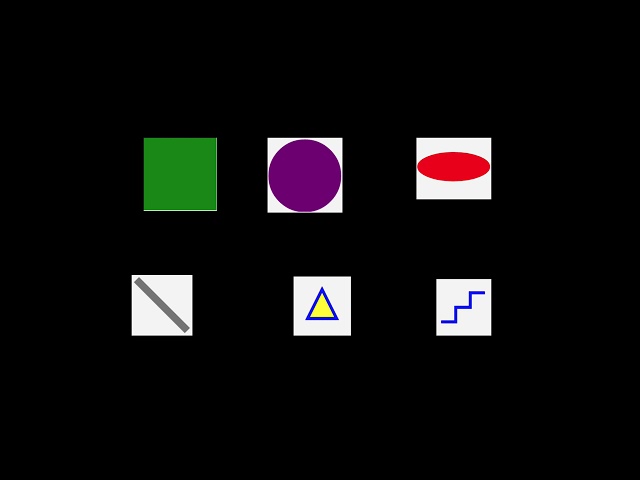
Learn SVG Fundamentals to create amazing Data Visualizations using D3.js. D3.js v3 Tutorial.
1,493 views
In this episode, we set the table for data visualization greatness! A few resources I shared: - Observable: https://observablehq.com ...
3,446 views
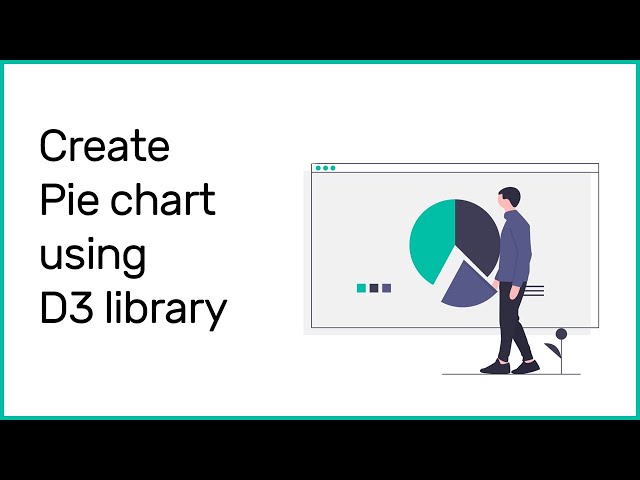
Using d3js library we create a simple pie chart with labels. Link to Prototype: ...
7,088 views
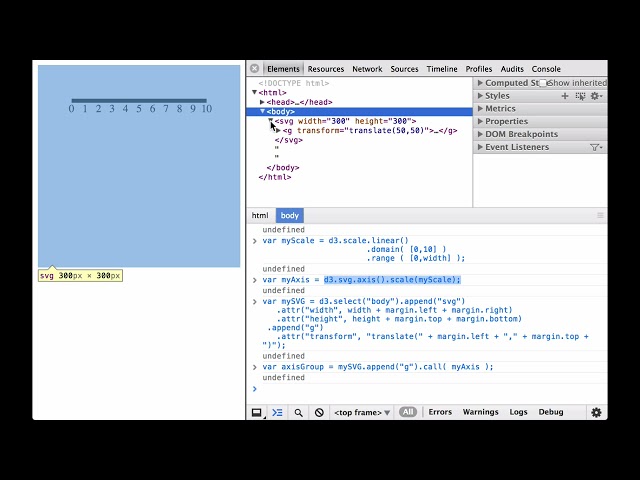
How to use D3.js Axis components to create amazing Data Visualizations! D3.js v3 Tutorial.
480 views
Learn how to use D3 and the JSON Data Format to create amazing Data Visualizations using D3.js. D3.js v3 Tutorial.
2,958 views
Create Beautiful Bar Charts in D3 - Beginners Guide. In this two-part series, I'll walk through building a basic D3.js bar chart, and ...
6,016 views
This video is part of an online course, Data Visualization and D3.js. Check out the course here: ...
5,063 views
10 years ago
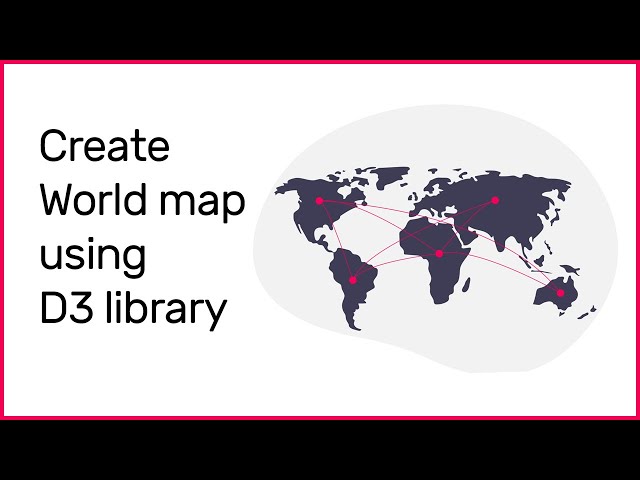
Use D3.js and Map Projections to create D3 Map Data Visualizations! D3.js v3 Tutorial.
793 views
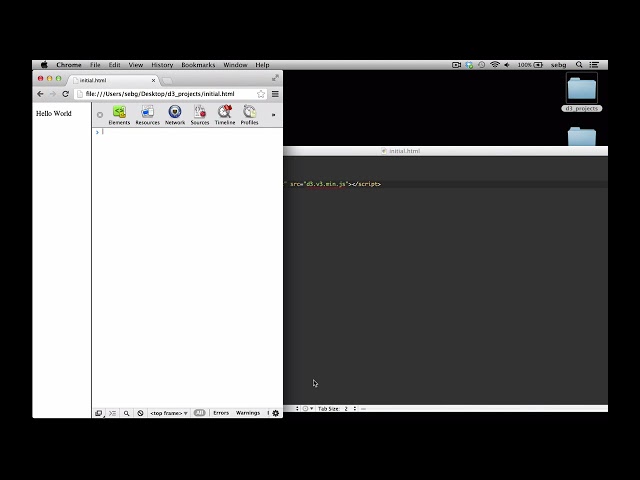
D3.js Setup so you can create awesome D3 Data Visualizations! D3.js v3 Tutorial.
4,056 views
Add SVG Elements to your Data Visualization Webpage using D3.js. D3.js v3 Tutorial.
1,409 views