Upload date
All time
Last hour
Today
This week
This month
This year
Type
All
Video
Channel
Playlist
Movie
Duration
Short (< 4 minutes)
Medium (4-20 minutes)
Long (> 20 minutes)
Sort by
Relevance
Rating
View count
Features
HD
Subtitles/CC
Creative Commons
3D
Live
4K
360°
VR180
HDR
169 results
gnuplot #python #pythonprogramming LEARN GNUPLOT IN JUST 5 HOURS !!! * 1 HOUR CLASSES FOR FIVE DAYS VIA ...
386 views
1 year ago
This simulation is calculated by using the Runge Kutta 4th order method. At resonance points, two mass points pierces the motor.
1,284 views
7 years ago
Using monte carlo method, I simulated the probability that a drunk person can cross the bridge. 【Source code & Details】 ...
787 views
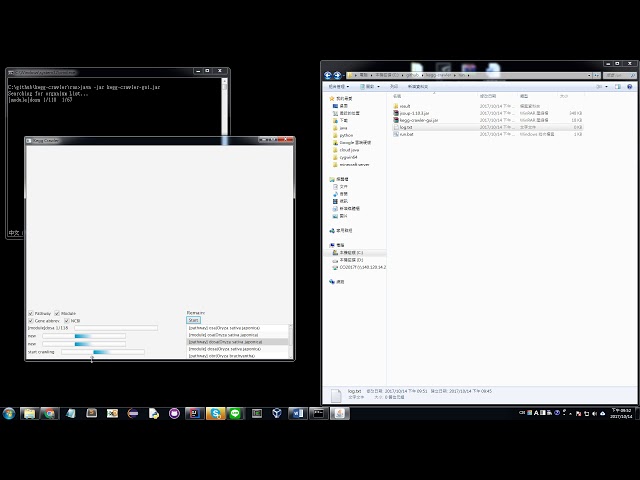
使用C++製作 引用資源: Gnuplot程式 gnuplot-iostream.h https://github.com/dstahlke/gnuplot-iostream ...
144 views
8 years ago
Gnuplot - We can also create an analogue spectrum by varying the hue component slightly while keeping the saturation and value ...
0 views
2 days ago
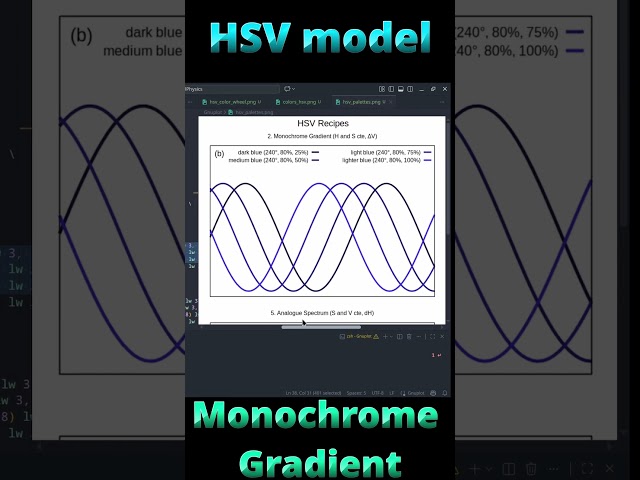
Gnuplot - We show how use a anchor color to create a monochrome gradient pallete color, where we fix hue and saturation while ...
13 days ago
Gnuplot - we create an intensity palette by keeping the hue constant while varying both the saturation and value components.
6 days ago
GNUPLOT - We show a simple example of the use of the HSV model in a Gnuplot script. M. Roos, master's in physics.
2 weeks ago
Gnuplot - We show how use a anchor color to create a triade pallete color in Gnuplot. M. Roos, master's in physics.
Gnuplot - we create a saturation gradient by keeping the hue and value constant while varying the saturation component M.
9 days ago
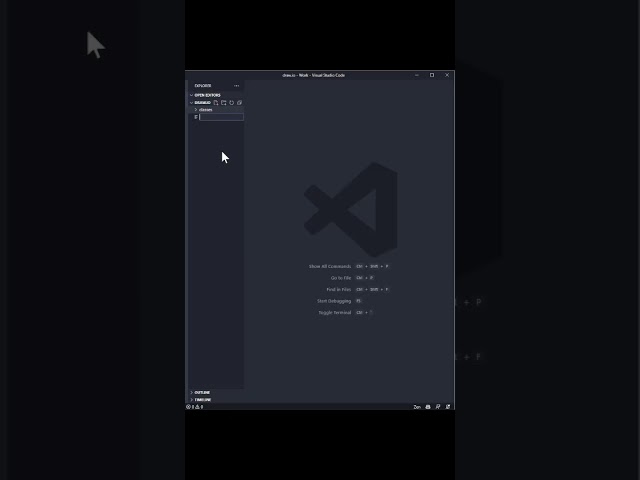
with the Draw.io Integration Extension!
279,043 views
2 years ago
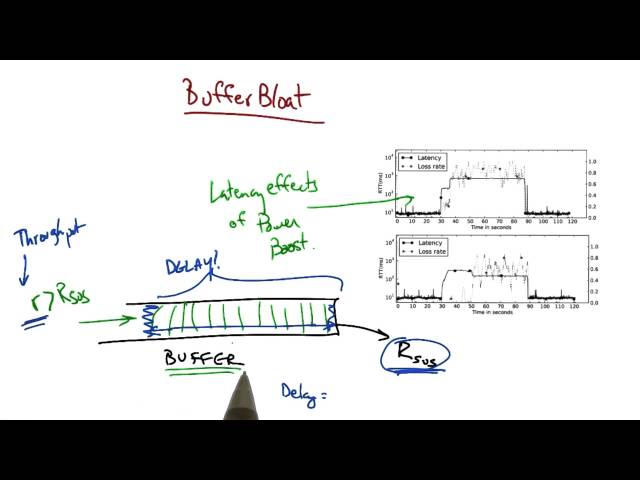
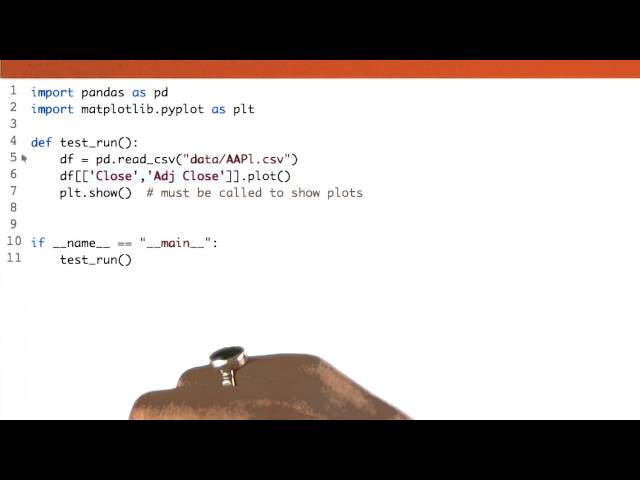
This video is part of the Udacity course "Machine Learning for Trading". Watch the full course at ...
5,439 views
9 years ago
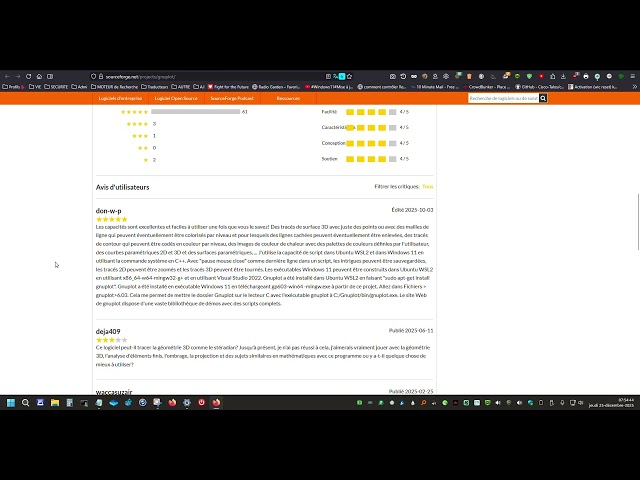
Gnuplot est un utilitaire de création de graphiques portable en ligne de commande, compatible avec Linux, OS/2, MS Windows, ...
1 view
1 month ago
This video is part of an online course, Intro to Parallel Programming. Check out the course here: ...
1,594 views
10 years ago
Watch on Udacity: https://www.udacity.com/course/viewer#!/c-ud436/l-3630539349/m-428628580 Check out the full Computer ...
2,136 views
49 views
This video is part of an online course, College Algebra. Check out the course here: https://www.udacity.com/course/ma008.
68 views
21,627 views
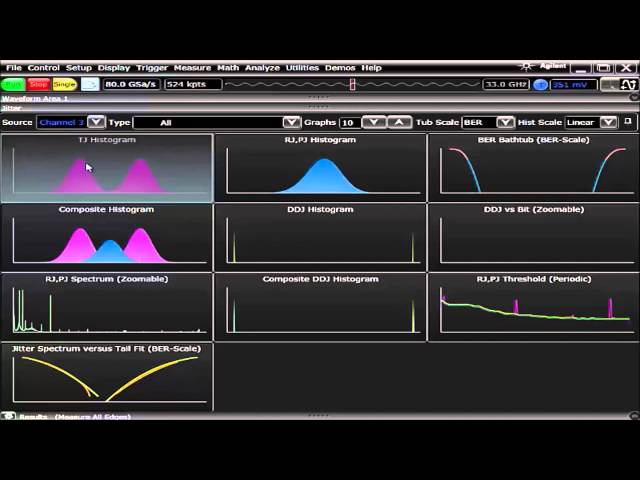
See how easy it is to get customized views of graphs with Keysight's next-generation user interface for Infiniium oscilloscopes.
466 views
11 years ago
We use an iterative edge decomposition approach, derived from the popular iterative vertex peeling strategy, to globally split each ...
458 views

![Analysis of Vibration of a Two Degree of Freedom System [gnuplot]](/api/proxy/image?url=https%3A%2F%2Fi.ytimg.com%2Fvi%2Fxcsnb-B2nGo%2Fsddefault.jpg)
![Probability That a Drunk Person Can Cross the Bridge [gnuplot]](/api/proxy/image?url=https%3A%2F%2Fi.ytimg.com%2Fvi%2FqY44Qsi9BHc%2Fsddefault.jpg)