Upload date
All time
Last hour
Today
This week
This month
This year
Type
All
Video
Channel
Playlist
Movie
Duration
Short (< 4 minutes)
Medium (4-20 minutes)
Long (> 20 minutes)
Sort by
Relevance
Rating
View count
Features
HD
Subtitles/CC
Creative Commons
3D
Live
4K
360°
VR180
HDR
2,605,040 results
I think we've only got small/medium socks left as part of the mystery sock sale, but you can still get them for $40 (INSTEAD OF 90!
342,659 views
6 months ago
Welcome to our comprehensive guide on the essentials of graph theory, focusing on "Vertices and Edges Explained." Are you ...
5,587 views
1 year ago
Join the community → https://www.systemsinnovation.network/spaces/20867260/page Find the complete set of Si Toolkit here ...
183,768 views
10 years ago
Join the FREE community: https://omniscient.mn.co/plans/1873326 Work with me: https://calendly.com/d/cs9y-6kn-2n2 --- Your ...
45,525 views
4 months ago
Welcome to our detailed tutorial on "What are the Weights of a Graph in Graph Theory?" Are you intrigued by how graphs can be ...
2,355 views
This video gives a little bit of information about interpreting the motion based on the position vs time graph, the velocity vs time ...
285,926 views
11 years ago
I totally like trying to embrace who I am! #shorts.
575,745 views
4 days ago
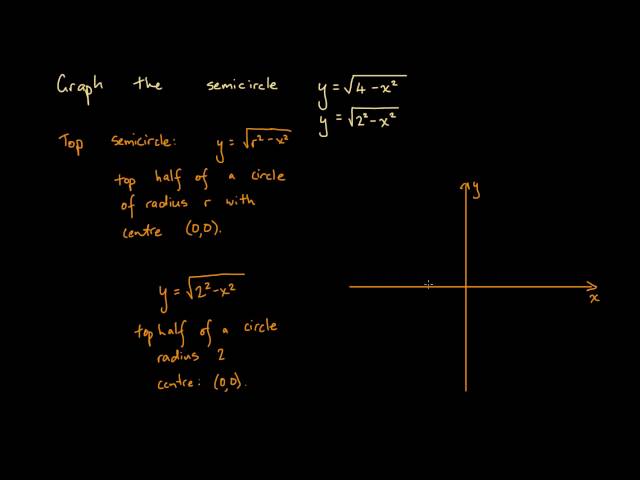
Watch this video to discover how to plot straight lines onto a graph. Start by creating a table of values, choosing values of x to ...
180,844 views
9 years ago
In this video I explain Externalities and how to show an Externality on a graph. I cover the definition of Externalities and provide an ...
2,272 views
A free math video lesson on Graph Functions using Reflections about the x-axis and the y-axis. This lesson is based on the open ...
484 views
5 years ago
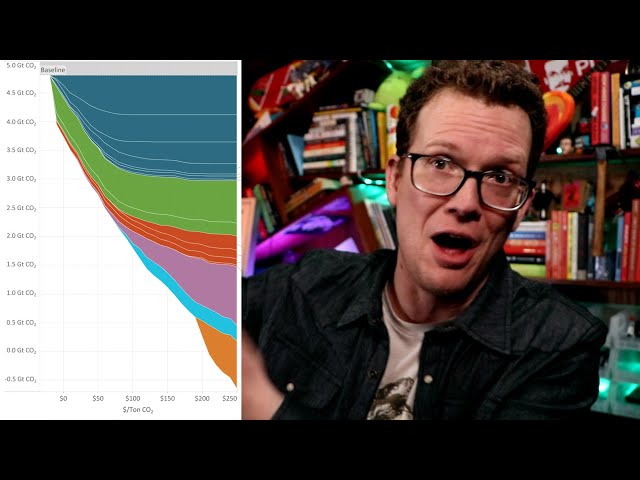
Thanks to the folks at the Environmental Defense Fund for helping make the Marginal Abatement Cost Curve a thing that exists.
408,355 views
Do you want to know how to make a graph with Microsoft Access? First, create a query with the data for the chart. Then make a ...
124,655 views
Using the first derivative test to find increasing/decreasing regions and the second derivative to determine concavity, we graph a ...
15,746 views
7 years ago
This is the seventeenth lecture in the Probabilistic ML class of Prof. Dr. Philipp Hennig in the Summer Term 2020 at the University ...
21,298 views
Learn how to plot quadratic curves, using a table of values. Quadratic curves are either a U shape, if they are positive quadratics, ...
57,018 views
Ever wonder what is the difference between property graphs and triple stores? aka labeled property graphs and RDF triple or ...
4,842 views
Professional Downward Stock Trend Animation – Perfect for financial analysis, bear market content, and economic warnings.
44,436 views
9 months ago
More free lessons at http://markacademy.org/.
28,559 views
In this video we learn about path finding algorithms, like shortest path, single source shortest path, and all pairs shortest path.
10,674 views
In this video we look at graphing equations using a table of values.
192,897 views
15 years ago


![FREE Downward Stock Trend Graph [4K Green Screen] - No Copyright Finance VFX for Stock Market](/api/proxy/image?url=https%3A%2F%2Fi.ytimg.com%2Fvi%2FRk80hkDkANo%2Fsddefault.jpg)