Upload date
All time
Last hour
Today
This week
This month
This year
Type
All
Video
Channel
Playlist
Movie
Duration
Short (< 4 minutes)
Medium (4-20 minutes)
Long (> 20 minutes)
Sort by
Relevance
Rating
View count
Features
HD
Subtitles/CC
Creative Commons
3D
Live
4K
360°
VR180
HDR
120 results
Join My Skool Community (FULL Templates & more) - https://www.skool.com/ai-automations-for-sales Sign up to Perplexity ...
1,756 views
4 days ago
Forget what you thought you knew about Google NotebookLM; it's evolved beyond a simple note-taking app. This video explores ...
368 views
My Microsoft Excel Playlist: https://www.youtube.com/playlist?list=PLHrw3fxxgFBRyH308kfvRZnAIevkaKkf0 Are you using Pie ...
7,601 views
3 days ago
Using Pivot Tables in Excel to Summarize Daily CoAgMet Weather Data over Five Months.
33 views
6 days ago
Importing Daily Weather Data from CoAgMet to Excel, and plotting data.
31 views
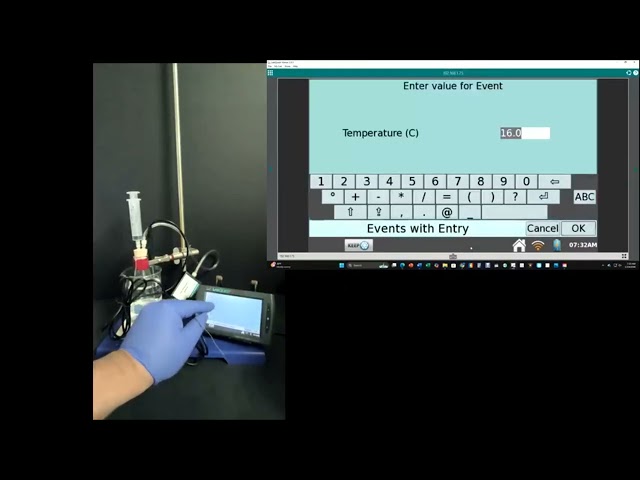
This is a similation incorporating studying the relationship between temperature and volume. Question: Linear or Indirect?
0 views
BioniChaos: Building a Prosthetic Arm Simulation with Vanilla JS and AI Data Science Are you interested in the intersection of ...
This video focuses on the low-level graph_objects interface of plotly, with some recipes to add additional interactive features such ...
7 views
1 day ago
PAC Convergence bounds: Markov Inequality, Chebyshev Inequality, Chernoff-Hoeffding Inequality.
Streamed 1 day ago
Artificial Analysis has a free AI model recommender that helps you pick the right model based on what you care about. Intelligence ...
This is a similation incorporating studying the relationship between pressure and amount in terms of "PUFFS". Question: Linear or ...
This is a similation incorporating studying the relationship between pressure and temperature. Question: Linear or Indirect?
This session introduces how Pandas and SQL work together inside Azure Databricks for data analysis and data preparation.
2 days ago
My Microsoft Excel Playlist: https://www.youtube.com/playlist?list=PLHrw3fxxgFBRyH308kfvRZnAIevkaKkf0 Are you using 3-D ...
10,940 views
Find out why AutoDS is the world's best dropshipping tool for $1: https://bit.ly/3NF9F0w AutoDS just released a powerful new ...
1,551 views
Deep Learning Series : https://www.youtube.com/playlist?list=PLMIHypEMTeA9pDtihfteSDKDsNVpyC5Q1 AIML Lecture Series ...
243 views
In this video, I use https://infranodus.com to map out what people talk about in relation to AI (based on the top 1200 YouTube ...
1,039 views
5 days ago
Learn how to use the VLOOKUP function in Excel step by step with real, practical examples. In this video, I explain VLOOKUP ...
12 views
Learn the exact step‑by‑step roadmap to become a Data Analyst without coding, avoid common mistakes, and land a high‑paying ...
366 views
7 days ago


![Azure Databricks | Introduction to Pandas with SQL | Data Engineering Tutorial by @igmGuru [2026]](/api/proxy/image?url=https%3A%2F%2Fi.ytimg.com%2Fvi%2Fj_xw8dTaTkM%2Fsddefault.jpg)


