Upload date
All time
Last hour
Today
This week
This month
This year
Type
All
Video
Channel
Playlist
Movie
Duration
Short (< 4 minutes)
Medium (4-20 minutes)
Long (> 20 minutes)
Sort by
Relevance
Rating
View count
Features
HD
Subtitles/CC
Creative Commons
3D
Live
4K
360°
VR180
HDR
3,347 results
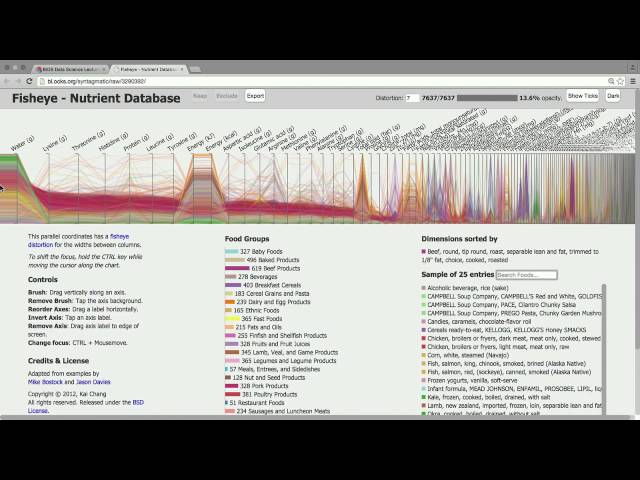
BIDS Data Science Lecture Series | March 13, 2015 | 1:00-2:30 p.m. | 190 Doe Library, UC Berkeley Speaker: Kai Chang, ...
33,671 views
Streamed 10 years ago
My talks are on the blocks page, D3 and canvas here. I'm going to go fast. So I don't know if you'll be able to read everything on ...
4,858 views
8 years ago
3,792 views
9 years ago
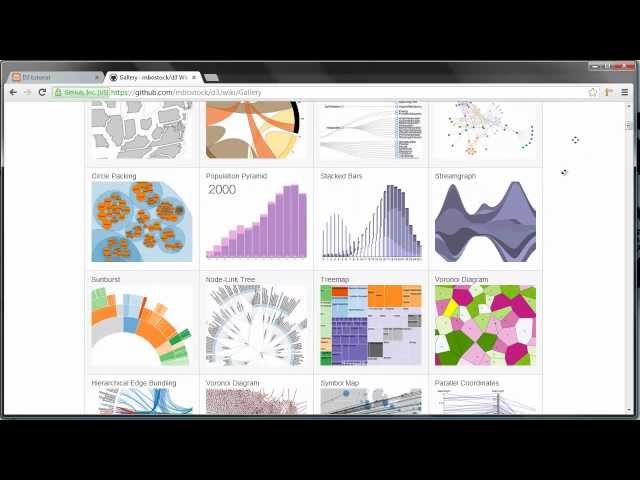
Full course updated for 2018 available here: https://www.youtube.com/watch?v=_8V5o2UHG0E This tutorial teaches data ...
310,503 views
10 years ago
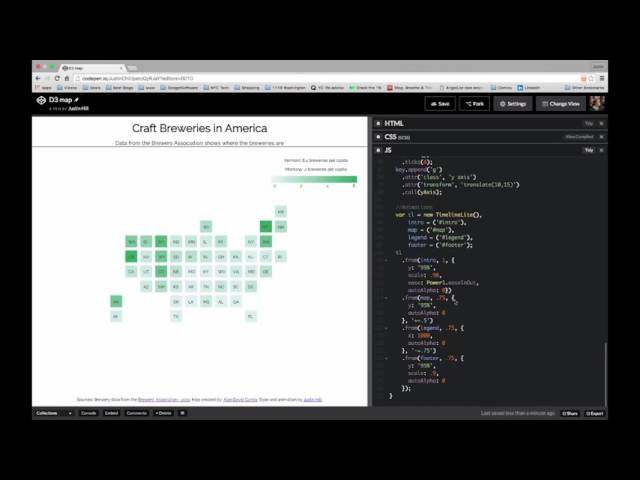
Maps are some of the most shared and sought after forms of visualisation. For this second video, I walk through an example that ...
8,351 views
2 years ago
Workshop – "Interactive Data for the Web Using the Javascript Library D3.JS" (David Onwukeme, former Digital Matters intern and ...
438 views
3 years ago
Part 1 of a series of tutorials on the Javascript library D3.
471,210 views
12 years ago
All about D3 Data Joins and how to use them. Also animated transitions!
16,405 views
7 years ago
How to tweak out axes of a bar chart with D3.js. Code: https://vizhub.com/curran/a44b38541b6e47a4afdd2dfe67a302c5 Part of ...
10,125 views
Learn D3.js basics by making a face whose eyebrows move.
9,090 views
"D3.js is a JavaScript library for manipulating documents based on data. D3 helps you bring data to life using HTML, SVG and ...
33,755 views
13 years ago
In this video, I look at a fairly simple area chart, with the added twist of a scroller to pan across the large area created by this ...
656 views
In this walkthrough, we look at the code behind this spinning globe graphic rendered to web canvas using d3js. To the globe: ...
640 views
How to write starter code for a responsive graphic using D3.js. Resulting program: ...
5,357 views
The best way to learn a new tool or language is to jump right in and start hacking. Philip Tellis leads participants through the new ...
314 views
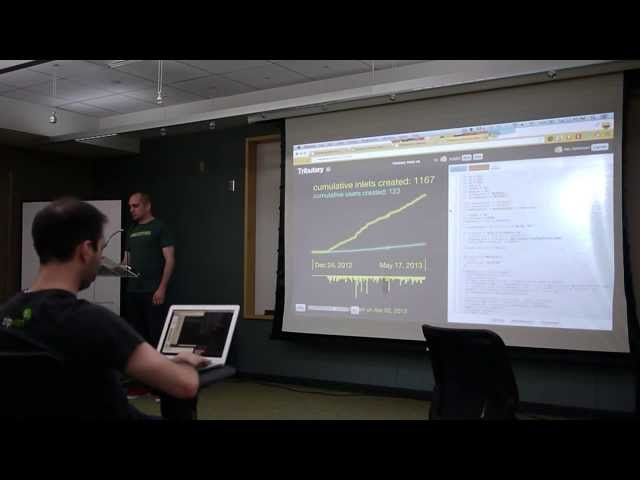
Talk given by Ian Johnson (@enjalot) to the Boston d3.js User Group on May 18th 2013. Slides: ...
4,030 views
Any visualization with axes needs a margin! Why not make it Responsive & Reusable? Previous Video "Responsive Visualization ...
1,865 views
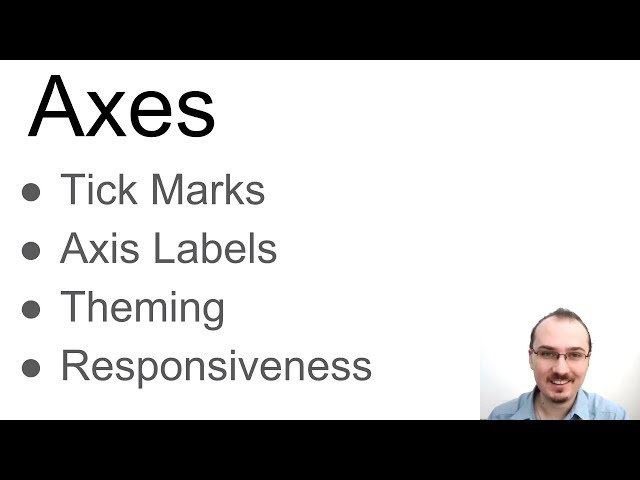
Coding up a storm with sweet D3 Axes. Previous Video: ...
6,106 views
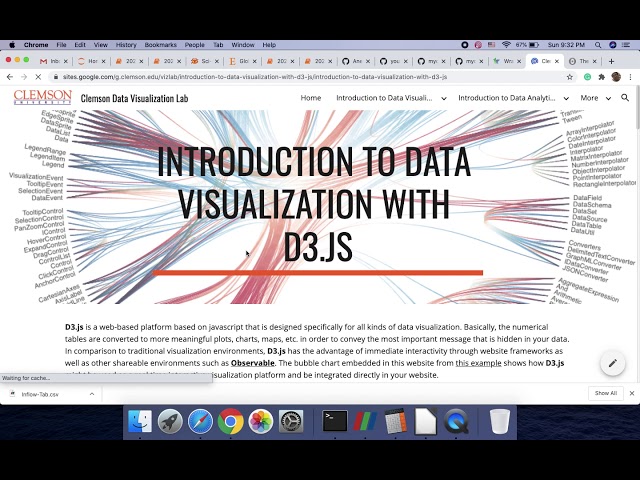
Introduction to data visualization with D3.js and its development environment.
110 views
5 years ago
3,075 views