Upload date
All time
Last hour
Today
This week
This month
This year
Type
All
Video
Channel
Playlist
Movie
Duration
Short (< 4 minutes)
Medium (4-20 minutes)
Long (> 20 minutes)
Sort by
Relevance
Rating
View count
Features
HD
Subtitles/CC
Creative Commons
3D
Live
4K
360°
VR180
HDR
98 results
EmacsConf 2022: Health data journaling and visualization with Org Mode and GNUplot - David O'Toole (he/him) ...
2,668 views
3 years ago
Sometimes we need to show more than one data set on a figure. This video shows a couple techniques for doing that, within the ...
630 views
5 years ago
https://doi.org/10.7875/togotv.2023.043 Gnuplot (gnuplot) is a graph plotting software that runs on the command line for ...
3,478 views
2 years ago
https://doi.org/10.7875/togotv.2023.051 Gnuplot (gnuplot) is a graph plotting software that runs on the command line for ...
1,016 views
Embellishing a plot Title Label line width, color, style annotations.
6,950 views
11 years ago
Visualizations via http://math.bu.edu/DYSYS/applets/M-setIteration.html and http://home.comcast.net/~ssilveria1/default.html.
1,415 views
13 years ago
You can find the lecture notes and exercises for this lecture at https://missing.csail.mit.edu/2026/debugging-profiling/ 0:00:00 ...
2,338 views
2 days ago
https://emacsconf.org/2022/talks/detached 00:00:00.000 Intro 00:27.120 The problem 01:15.800 My solution: detached 02:30.840 ...
2,029 views
https://emacsconf.org/2022/talks/indieweb 00:00:00.000 Introduction 00:14.080 Maintaining a personal website using Org mode ...
904 views
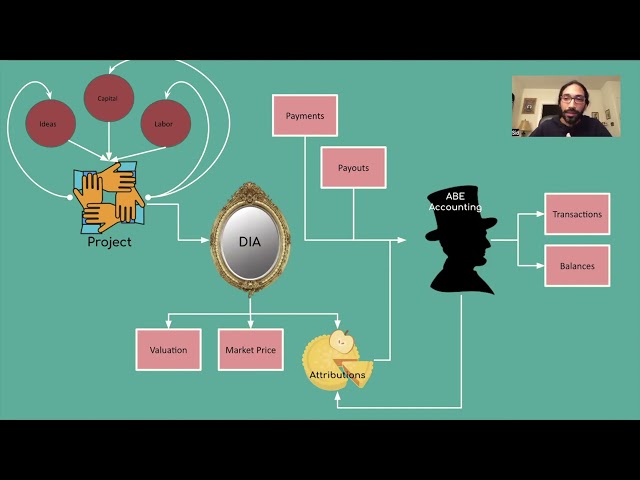
EmacsConf 2022: Maintaining the Maintainers: Attribution as an Economic Model for Open Source - Sid Kasivajhula (he/him or ...
672 views
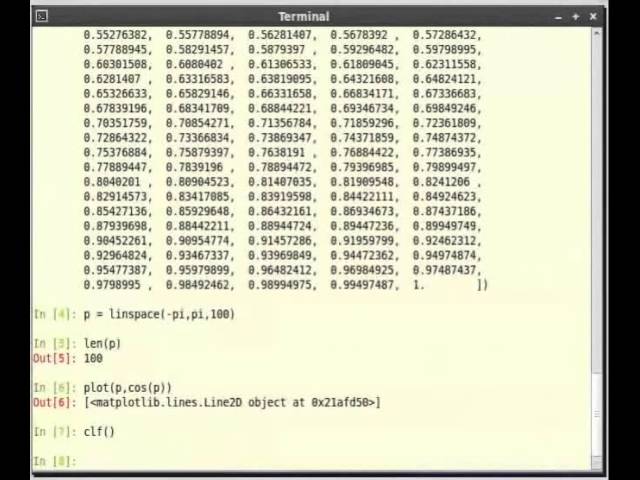
Using the plot command interactively ipython -pylab pylab brings in the libraries necessary for Scientific Computing. linspace, len ...
10,770 views
RubyConf 2018 - RubyPlot - Creating a Plotting Library for Ruby by Pranav Garg The talk introduces Rubyplot - the plotting library ...
933 views
7 years ago
This is a new format of short tutorial for using the GDIS visualization software [1] with USPEX [2], VASP [3], and GULP [4]. *** In this ...
1,028 views
Integration of USPEX to the GDIS visualization software. This is the presentation for the tutorial session 3 of the 17th USPEX ...
1,485 views
6 years ago
work in progress for an adaptive mode for GNOME Files, mostly useful for whoever runs GNOME on a phone #GNOME #GTK ...
2,929 views
https://emacsconf.org/2022/talks/science 00:00:00.000 My second brain 00:28.320 Contents of the talk 01:40.560 Bibliography ...
2,237 views
Formative Grapher is an open-source application for Microsoft Excel that is designed for creating and updating complex graphs for ...
1,685 views
8 years ago
Lecture 57 : Spoken tutorials on WHO weight-for-age and length-for-age percentile growth charts.
1,520 views
In this video, I demonstrate a visual alternative to #chatgpt made using #infranodus. It builds a live knowledge graph of a ...
19,041 views
A quick look at using x11/xinit manually. https://twitter.com/hackersgametoo Patreon: https://www.patreon.com/hackersgametoo ...
10,178 views