Upload date
All time
Last hour
Today
This week
This month
This year
Type
All
Video
Channel
Playlist
Movie
Duration
Short (< 4 minutes)
Medium (4-20 minutes)
Long (> 20 minutes)
Sort by
Relevance
Rating
View count
Features
HD
Subtitles/CC
Creative Commons
3D
Live
4K
360°
VR180
HDR
98 results
EmacsConf 2022: Health data journaling and visualization with Org Mode and GNUplot - David O'Toole (he/him) ...
2,668 views
3 years ago
https://doi.org/10.7875/togotv.2023.043 Gnuplot (gnuplot) is a graph plotting software that runs on the command line for ...
3,478 views
2 years ago
Sometimes we need to show more than one data set on a figure. This video shows a couple techniques for doing that, within the ...
630 views
5 years ago
https://doi.org/10.7875/togotv.2023.051 Gnuplot (gnuplot) is a graph plotting software that runs on the command line for ...
1,016 views
You can find the lecture notes and exercises for this lecture at https://missing.csail.mit.edu/2026/debugging-profiling/ 0:00:00 ...
2,338 views
2 days ago
Embellishing a plot Title Label line width, color, style annotations.
6,951 views
11 years ago
The command line debugger that comes with perl is very powerful. Not only does it allow us to debug script but it can be used as a ...
8,002 views
14 years ago
Visualizations via http://math.bu.edu/DYSYS/applets/M-setIteration.html and http://home.comcast.net/~ssilveria1/default.html.
1,415 views
13 years ago
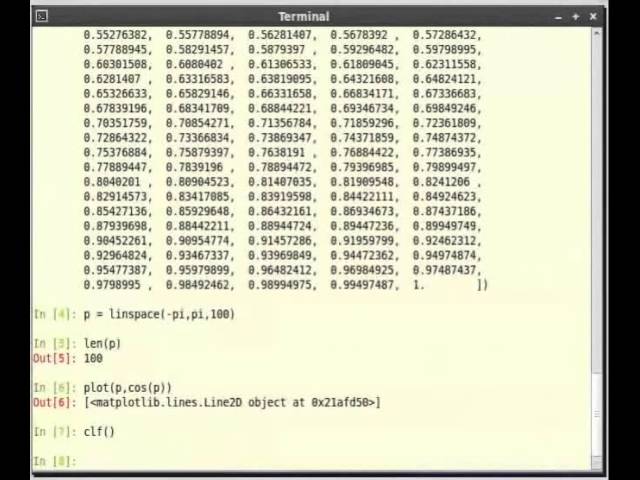
Using the plot command interactively ipython -pylab pylab brings in the libraries necessary for Scientific Computing. linspace, len ...
10,772 views
https://emacsconf.org/2022/talks/indieweb 00:00:00.000 Introduction 00:14.080 Maintaining a personal website using Org mode ...
904 views
Finding the area under the curve and between curves - including when the curve is negative.
160 views
6 years ago
work in progress for an adaptive mode for GNOME Files, mostly useful for whoever runs GNOME on a phone #GNOME #GTK ...
2,929 views
Formative Grapher is an open-source application for Microsoft Excel that is designed for creating and updating complex graphs for ...
1,685 views
8 years ago
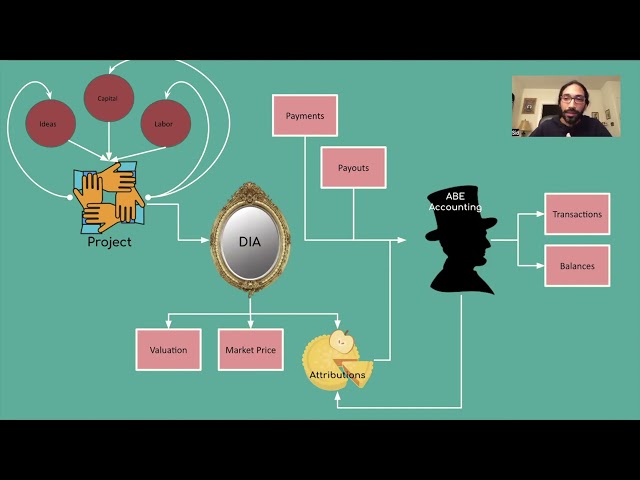
EmacsConf 2022: Maintaining the Maintainers: Attribution as an Economic Model for Open Source - Sid Kasivajhula (he/him or ...
672 views
https://emacsconf.org/2022/talks/orgyear 00:00:00.000 Introduction 00:32.080 Project housekeeping 01:08.800 Continuous ...
1,107 views
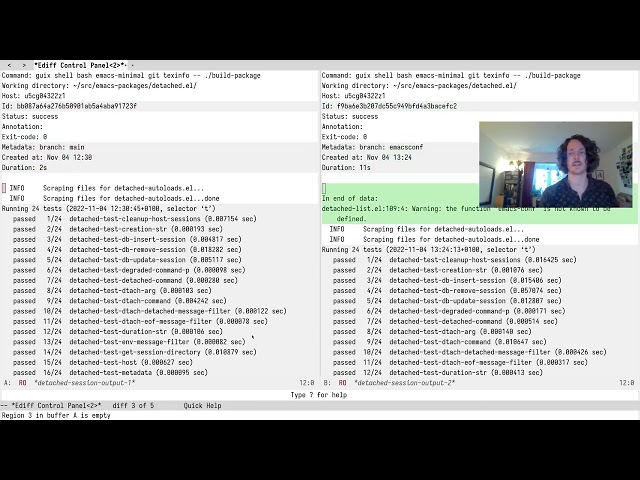
https://emacsconf.org/2022/talks/detached 00:00:00.000 Intro 00:27.120 The problem 01:15.800 My solution: detached 02:30.840 ...
2,029 views
In this video, I demonstrate a visual alternative to #chatgpt made using #infranodus. It builds a live knowledge graph of a ...
19,041 views
https://emacsconf.org/2022/talks/buddy 00:00:00.000 Introduction 00:27.900 Why Emacs Buddy? 01:32.720 What can you expect ...
RubyConf 2018 - RubyPlot - Creating a Plotting Library for Ruby by Pranav Garg The talk introduces Rubyplot - the plotting library ...
933 views
7 years ago
Integration of USPEX to the GDIS visualization software. This is the presentation for the tutorial session 3 of the 17th USPEX ...
1,485 views