Upload date
All time
Last hour
Today
This week
This month
This year
Type
All
Video
Channel
Playlist
Movie
Duration
Short (< 4 minutes)
Medium (4-20 minutes)
Long (> 20 minutes)
Sort by
Relevance
Rating
View count
Features
HD
Subtitles/CC
Creative Commons
3D
Live
4K
360°
VR180
HDR
515,763 results
Data-Driven Documents or D3 is a JavaScript library for drawing SVGs with data. It's the magic behind many of the graphs, charts, ...
586,439 views
4 years ago
Learn data visualization with D3.js. D3 is a JavaScript library for manipulating documents based on data. D3 helps you bring data ...
363,144 views
3 years ago
This course teaches you how to visualize data in the browser using D3.js. Watch it here or check out the interactive version at ...
335,603 views
7 years ago
Watch the updated version of this course: https://youtu.be/2LhoCfjm8R4 In this data visualization course, you'll learn how to ...
1,158,135 views
6 years ago
D3.js is a great library for building interactive visualizations (e.g. charts) with data, the DOM and JavaScript. Learn how to get ...
254,956 views
5 years ago
In this video, you'll learn how to build a simple and interactive dashboard using Python and the Dash framework. Dash is a ...
801,117 views
2 years ago
In this video, we dive into the wonderful world of d3 scales. resources: - d3js api: ...
1,364 views
React Admin Dashboard Tutorial from scratch. We will be using React, Material UI, Nivo Charts, Formik, Yup, FullCalendar, and ...
1,898,418 views
Learn more about the course here: https://bit.ly/3sHNDja Lesson 2 slides: https://bit.ly/3ZuhBnb Lesson 2 notebook: ...
6,957 views
Streamed 2 years ago
Shadcn/ui keeps paying dividends. Doing charts right is hard, so hyped we have a great starting point in React now. SOURCE ...
121,836 views
1 year ago
Dive into the world of 3D web development with our comprehensive 7-hour Three.js crash course. Taught by industry expert Jesse ...
212,389 views
Today we cover the most foundational aspect of data visualization - Data! After watching this video you'll know: - how to read tsv, ...
2,493 views
This is a D3.js and React.js tutorial that takes you through the steps to build a responsive Line chart using react hooks. Intro and ...
14,507 views
In this video I will show you how to create an interactive horizontal tree with D3 using JSON. This video is not intended for ...
33,427 views
D3.js resources: 》Observable https://observablehq.com/explore 》Mike Bostock's blocks page https://bl.ocks.org/mbostock.
40,849 views
Learn Data Visualization with D3, JavaScript, and React. Part 2: https://youtu.be/H2qPeJx1RDI Created by @currankelleher .
518,276 views
Linode $20 free credit https://linode.com/codingtrain (or code “CODINGTRAIN20”) Shirley Wu is an award-winning creative ...
56,753 views
Streamed 6 years ago
This video is a part of a Full Course you can get on Udemy at a special discount: https://bit.ly/2BAGzaE We've moved! For more ...
83,068 views
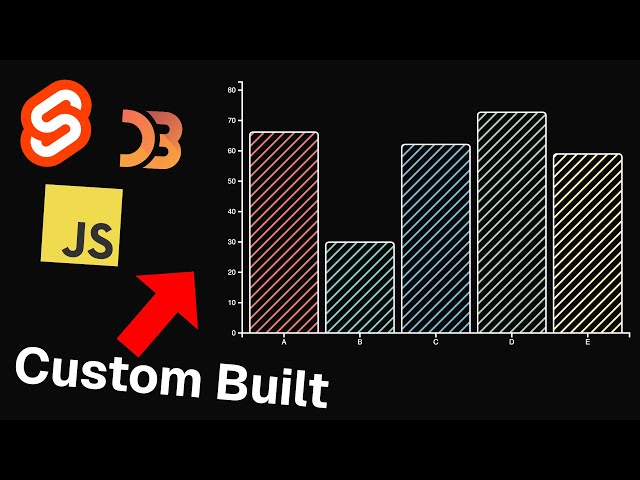
Wanted to show off something I'm working with D3 and Svelte (a fantastic combination btw). Check out the repo here: ...
12,056 views
Welcome to a youtube channel dedicated to programming and coding related tutorials. We talk about tech, write code, discuss ...
61,019 views
Link to prototype: http://kodhus.com/kodnest/codify/1581856a270164263514a596842528a6/layout/1.
31,896 views
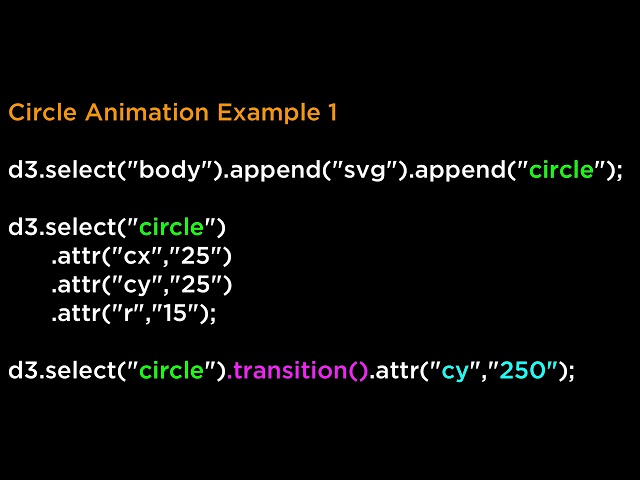
Create and Use SVG Transition Animations using D3.js to create amazing Data Visualizations. D3.js v3 Tutorial.
1,011 views
Create Beautiful Line Charts in D3 - Beginners Guide. In this three-part series, I'll walk through building a basic D3.js line chart, ...
24,258 views
Are you a beginner looking to learn how to use Google Charts? Look no further! In this video, I'm going to show you the basics of ...
6,521 views
Want to learn Power BI fast? Start with this beginner-friendly tutorial where you'll import data, clean it, build your first interactive ...
971,231 views
7 months ago
Apache ECharts is a mighty tool. You do not need a senior Javascript developer to start displaying modern-looking animated ...
18,693 views
Visualize a tree! Tips & tricks mixed throughout. Code: https://vizhub.com/curran/4f92c793909f48d28012e43ddab716df Part of ...
28,769 views
Sign up for https://funfun.email to learn more about our D3 and data visualization plans! Dirty D3 won't be the most pedagogical ...
14,609 views
Learn more about the course here: https://bit.ly/3sHNDja Lesson 1 slides: https://bit.ly/3roPVn7 Lesson 1 notebook: ...
19,796 views


![D3 JS - Build Data Driven Visualizations with Javascript [svg animation, data engineering]](/api/proxy/image?url=https%3A%2F%2Fi.ytimg.com%2Fvi%2FnzshmMlOuwI%2Fsddefault.jpg)