Upload date
All time
Last hour
Today
This week
This month
This year
Type
All
Video
Channel
Playlist
Movie
Duration
Short (< 4 minutes)
Medium (4-20 minutes)
Long (> 20 minutes)
Sort by
Relevance
Rating
View count
Features
HD
Subtitles/CC
Creative Commons
3D
Live
4K
360°
VR180
HDR
144,446 results
Get the map of control theory: https://www.redbubble.com/shop/ap/55089837 Download eBook on the fundamentals of control ...
1,365,273 views
13 years ago
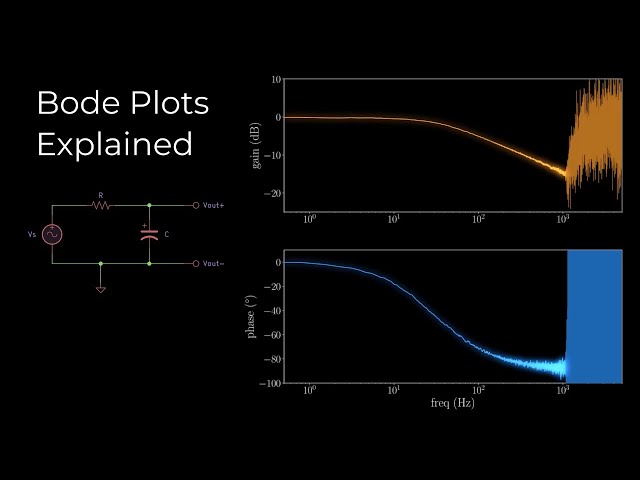
Bode plots are an essential but sometimes confusing tool for frequency domain analysis. In this video, we'll start with an intuitive ...
94,064 views
2 years ago
Andrew Finelli, of UConn HKN, creates the Bode Plots for a given transfer function.
200,905 views
10 years ago
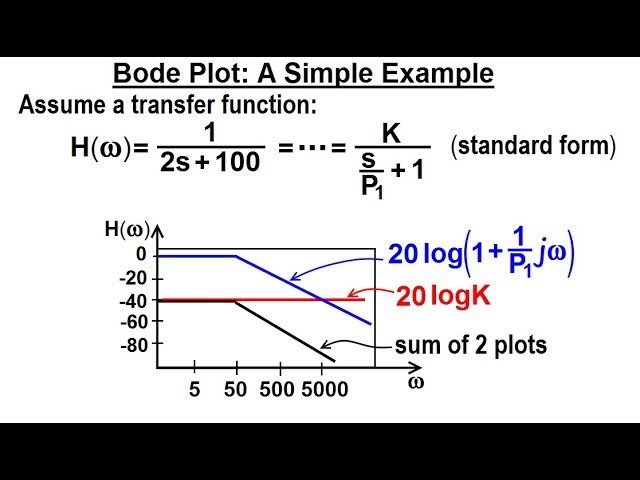
Visit http://ilectureonline.com for more math and science lectures! Before analyzing the Bode function for each of the 7 factors for a ...
183,046 views
6 years ago
Explore three popular methods to visualize the frequency response of a linear time-invariant (LTI) system: the Nichols chart, the ...
129,327 views
5 years ago
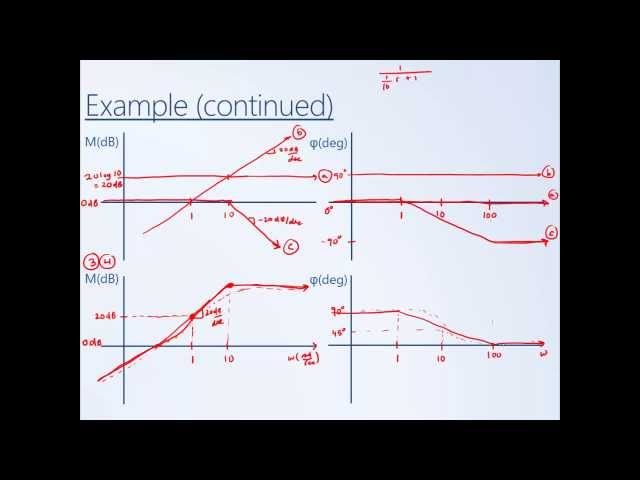
Introduces how to generate a straight-line approximation of a system's Bode diagram by hand.
68,402 views
12 years ago
662,820 views
This video illustrates the steps to draw Bode plot for a given Transfer Function and also explains how to find Gain Margin (GM) ...
278,737 views
(a) Construct the Bode straight-line approximation magnitude and phase plots of H(s) using the paper-and-pencil method.
154,747 views
Learn how to build Bode plots for first-order systems in this MATLAB® Tech Talk by Carlos Osorio. A Bode plot describes the ...
43,941 views
Given a transfer function, find the magnitude bode plot. No poles or zeros at origin.
32,855 views
Learn the principal characteristics of a Bode plot in this MATLAB® Tech Talk by Carlos Osorio. This video explains how a Bode ...
3,559 views
4 months ago
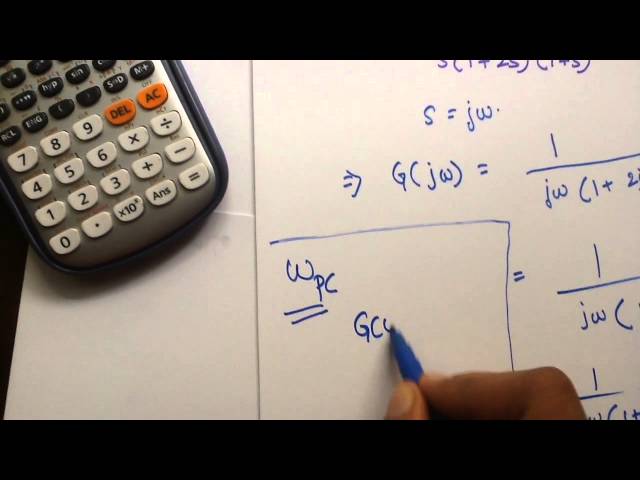
This video clearly explains how to find out the phase cross over frequency and gain margin of a transfer function without plotting a ...
314,185 views
11 years ago
... system is unstable for values of K below zero let's now return K back to 1. As we increase K past 1 we see that the Nyquist plot ...
129,663 views
398,941 views
Control theory is a mathematical framework that gives us the tools to develop autonomous systems. Walk through all the different ...
833,429 views
3 years ago
In this video we introduce the concept of Bode plots including what they represent, how they are generated, as well as how to use ...
21,789 views
This presentation provides a basic introduction to Bode plots and explains how Bode plots can be used with an oscilloscope to ...
48,264 views
Learn how frequency domain analysis helps you understand the behavior of physical systems in this MATLAB® Tech Talk by ...
105,659 views
By Ahmed Abu-Hajar, Ph.D. This is a Bode plot example to help my students in the Linear Controls course. I decided to share it ...
523,111 views
Going through how to draw the approximate bode plot for a system with one zero and two poles.
130,939 views
712,738 views
controlengineering #controltheory #mechatronics #machinelearning #robotics #electricalengineering #mechanicalengineering ...
2,143 views
Bode plot control system Support My Work: If you'd like to support me, you can send your contribution via UPI: ...
1,148,864 views
4 years ago
In this video, I have solved an example on how to sketch the bode magnitude and phase plot. The book that I am referring to in this ...
649,474 views
9 years ago
Tutorial video for ECE 220 class at Mason.
404,035 views